
This is Part IV of a multi-part series on why we should get serious about launching a green bank in Georgia. If you missed Part I, you can find it here, Part II here, and Part III here.
The Drawdown Georgia Overlay
The first three posts laid out the opportunity for a green bank more generally and could be applied to almost any geography. The final step is to go beyond the broad strokes and dive into the specific subsectors that are important to Georgia’s economy. The hardest part for a green bank focused on the low-carbon transition is figuring out what sectors to focus on. Luckily for Georgia, the Drawdown Georgia (DDGA) researchers have done the heavy lifting. DDGA research identified 20 of the most impactful solutions for transitioning the state to a low-carbon economy.
Despite the substantial headstart, DDGA solutions only get us part of the way to understanding the scope and scale of the businesses that will drive the transition. The next step is to match DDGA solutions with the thousands of companies driving their adoption. The best way to do that is by using standard government data classification systems like The North American Industry Classification System (NAICS).
The U.S. Census publishes an annual report called the Statistics of U.S. Businesses (SUSB) that uses two to six-digit NAICS codes and includes national, state, and county data. The advantage of the Census data is that it has annual counts of all firms, employees, payroll, and owner demographics within the select geography. This enables matching target solutions with standard industry data to see if there is a strategic advantage or disadvantage in the subregion. For example, higher concentrations of firms or employees within a subsector can suggest that the state enjoys a competitive advantage. To identify areas with high concentrations of particular businesses or employees, we can use a simple equation called Location Quotients.
Location Quotients (LQ) are a tool used to assess the relative strength of each subsector. LQs represent a subregion’s concentration of specific industries as measured by the number of firms or employees. An LQ over one (>1) means that the subregion (Georgia, in this case) has a higher concentration of a particular industry than the U.S. Using the SUSB data, LQs can be calculated for both employment and firms:
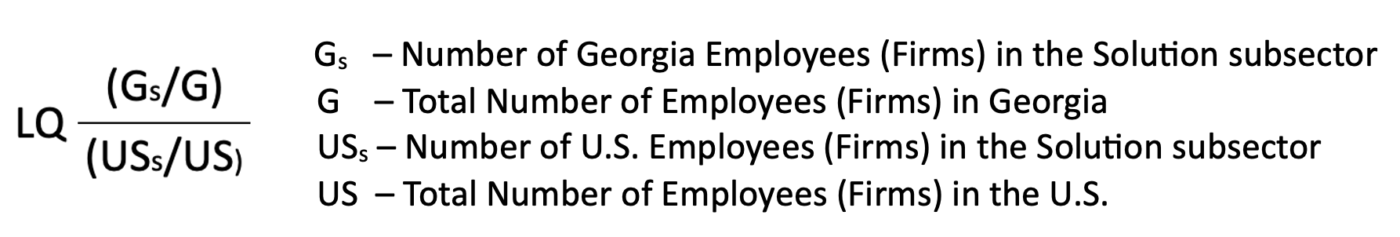
In addition to calculating LQs, the SUSB’s employee and payroll numbers allow us to target highly impactful industries within the state. The disadvantage of using SUSB data is that it omits agriculture production, only capturing the supporting industries like services, machinery, and processing. It is also worth noting that despite the most recent SUSB data being published within the last full year, the survey was performed in 2020.
NAICS codes can be oddly specific at times, creating a challenge for matching with DDGA solutions. For example, the DDGA “Retrofitting” solution impacts businesses that manufacture efficient windows (NAICS 321911 – Wood Window and Door Manufacturing) and HVACs (NAICS 333415 – Air-Conditioning and Warm Air Heating Equipment and Commercial and Industrial Equipment Manufacturing). It also includes Services like plumbers (NAICS 238220 – Plumbing, Heating, and Air Conditioning Contractors) and electricians (NAICS 238210 – Electrical Contractors and Other Wiring Installation Contractors), to name a few.
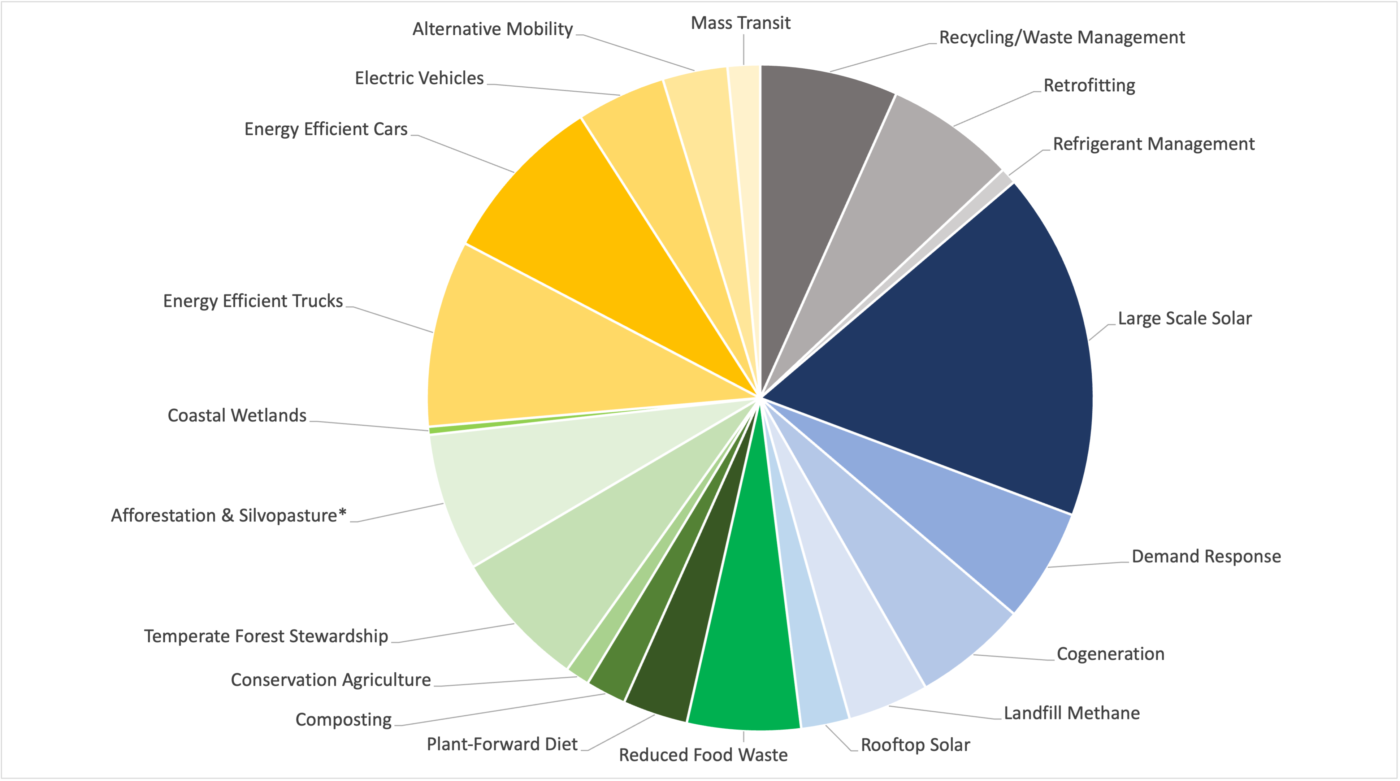
The details are a bit much for this post, but a summary of key findings is useful. The first step was to match the 20 DDGA solutions with the NAICS codes. The 20 solutions are grouped into five broad sectors, as displayed graphically below. Electricity (blue wedges) accounts for 34% of net-GHG emissions reduction potential, while Transportation (yellow) accounts for 26%. The other sectors are Buildings and Materials (grey – 14%), Food and Agriculture (light green – 12%), and Land Sinks (dark green – 14%).
Few of these subsectors match perfectly, and some judgment is needed (and should be debated) as to which NAICS codes best match each DDGA solution. The SUSB dataset for Georgia has 5600 unique primary NAICS codes, 160 of which made a preliminary match to GBGA’s solutions. The matching NAICS represent over 30 thousand firms, 600 thousand employees, and $35 billion in payrolls.

However, these are loosely matched, so not all those jobs will be directly impacted by the low-carbon transition. More work is needed to determine the strength and direction (+,-) of the impact. One source of data that can help guide future research is the DOE’s USEER report. For 2023 that report says there are over 100 thousand “clean jobs” in Georgia. That number doesn’t include indirect impact or jobs that are at risk.
Electricity
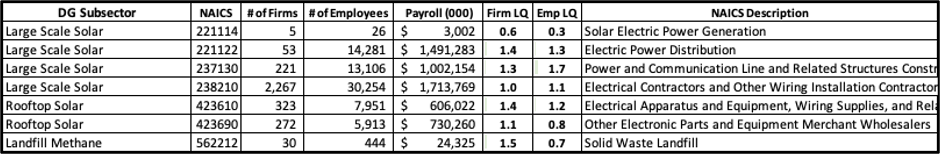
Georgia is 7th in the nation for solar energy production, but our data only shows five firms and 26 employees working in Solar Electricity Power Generation (NAICS 221114). This is most likely a classification issue, as the Solar Energy Industries Association (SEIA) calculates over 5,300 jobs and 224 firms working on solar in Georgia. Our data shows that related sectors, Electric Power Distribution (NAICS 221122) and Power and Communication Line and Related Structures Construction (NAICS 237130), are slightly concentrated in the state. When combined with Electrical Contractors and Other Wiring Installation Contractors (NAICS 239310), those three subsectors have than 2,800 businesses and over 50,000 employees.
Despite the incredible progress and growth of solar in Georgia, state utilities still imported over $3.7 billion of coal, gas, and oil in 2022 alone (based on our analysis of S&P CapIQ data). Georgia has almost no coal, oil, or natural gas production and relies on imported fuel for fossil fuel electricity generation. Even with the significant capital expenditures in existing power generation, the imports and limited direct economic activity in fossil fuels make a strong case for renewables in the state.
Transportation
Georgia’s electric and energy-efficient vehicle industry has been booming lately, but that still needs to be reflected in the NAICS data (our dataset uses data surveyed in 2020). There is an intense concentration of battery-related manufacturing, but the base is small. Recent announcements suggest it will grow substantially in the coming years.
Two transportation subsectors with a lot firms and employees in our dataset are Gasoline Stations with Convenience Stores (NAICS 447110) and General Automotive Repair (NAICS 811111). Both are likely to be impacted by the EV and energy-efficient vehicle transition. The unique ability of EVs and many hybrid vehicles to refuel at home or in the office parking lot is significant for gas stations. Low maintenance needs and over-the-air fixes for many new battery electric vehicles will impact auto repair stations. These highly fragmented subsectors suggest that small, family-owned businesses dominate them. Adapting to the approaching reality of an electric- and hybrid-vehicle-dominated ecosystem will be disruptive.
Buildings and Materials
Buildings are responsible for nearly one-third of Georgia’s GHG emissions and drive the vast majority of electricity demand. Building, rehabbing, and renovating them supports a $35 billion construction industry in the state, not to mention many professional services like architects, engineers, finance, and real estate. The real estate rental and leasing industry is the largest private industry in the state, making up 16% of GDP at over $110 billion annually.
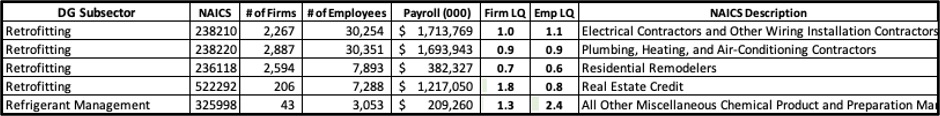
The SUSB data echoes the state’s substantial real estate and construction sectors. Georgia has a large employment base in many building-related subsectors. For this study, we focused on those most closely aligned with retrofitting, like Electrical Contractors and Other Wiring Installation Contractors (NAICS 238210); Plumbing, Heating, and Air-Conditioning Contractors (NAICS 238220); and Residential Remodeling (NAICS 236118). Just in the targeted subsectors, there are over 7,500 firms and nearly 70,000 employees.
The IRA’s substantial tax incentives for retrofitting and energy efficiency upgrades could be a significant buoy for the construction industry in Georgia, offsetting higher costs from inflation and rising interest rates.
Recycling & Waste Management
Recycling and waste management were broken out separately because the subsector is embedded across many industries. A great example of this is the carpet and rug sector. Georgia is a leader in carpet and rug manufacturing in the U.S., with LQs for firms of 15.6 and 23.3 for employees. By far the highest in this dataset. The industry consumes roughly one-third of recycled plastic bags in North America. The State is also home to the largest aluminum recycler in the country (Novelis). The Georgia Department of Economic Development reports that the aluminum recycling industry in Georgia employs over 20,000 people, and over “120 Georgia businesses use recovered materials to manufacture a variety of new consumer products”.
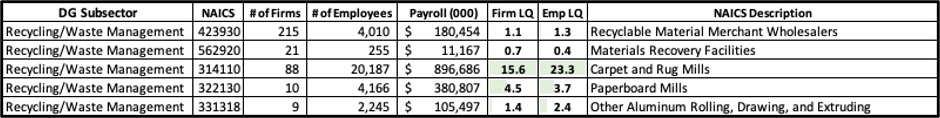
Despite the strength of industry processing and the use of recycled materials in the state, our data shows a need for more collection and sorting. Materials Recovery Facilities (NAICS 562920) or MRFs have fewer than half the expected number of employees in the state with employment LQ of 0.4. Firms are better represented with an LQ of 0.7 but still under the national average.
Food and Agriculture
The sources of GHG emissions from Food and Agriculture production are as varied as the products, and in fact, they often vary with the products. Some agriculture, when done sustainably, can be a carbon sink. Other parts, like poultry or meat production, are not likely to be net negative GHG emissions but could still reduce current emissions significantly. Based on the SUSB data, Food and Agriculture in Georgia are not concentrated at the top level, but there is significant concentration in critical subsectors like poultry and cotton.
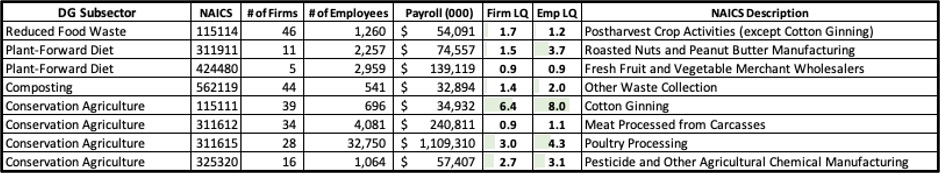
Poultry processing is a big business in Georgia, with nearly 33 thousand employees and over $1 billion in payroll annually. It also illustrates the complicated assessment of Food and Agriculture’s GHG emissions. Unlike large livestock (cows, pigs, and sheep), the birds are not significantly contributing to GHG emissions. However, livestock in Georgia still represent 45% of overall agriculture GHG emissions, and poultry processing is by far the largest concentration in that subsector. A recent report from Mississippi State University suggests that the GHG emissions from poultry are driven by energy usage for lighting (electricity) and warming (propane). These are GHG emissions covered by DDGA’s Electricity and Building & Materials solutions.
Cotton ginning may not employ many people, but its heavy concentration in the state is a proxy for the importance of the agricultural product itself. The cotton industry has the potential to support net GHG emissions reduction, but only if the associated cotton farming is sustainably done and the cotton ginning itself is done with renewable energy. Fortunately, organic cotton is predicted to grow by a compounding average annual rate of 40% by 2028, and an industry website states, “100% renewable energy use in gins could reduce GHG emissions by 6.2 million U.S. tons CO2 equivalent per year”.
Land Sinks
Georgia has “more plantation acres, total timberland acreage, and privately-owned timberland acreage than any other state in the US.” However, much of it is not dedicated to conservation. The Georgia Forestry Commission reports that there are over 55 thousand forest industry jobs in the state, creating over $37 billion in economic impact and contributing nearly $1 billion in tax revenue. Forests in Georgia are more than a big business; they also sequester over 1.5 billion metric tons of carbon. Conservation of these land sinks is critical in reducing net GHG emissions.
As noted earlier, our SUSB dataset has some limitations regarding conservation and agricultural activities. Like Food & Agriculture, we mapped Land Sinks subsectors to the dependent manufacturing and service industries. Using that data, we see high concentrations in some Georgia subsectors like logging, wood preservation, pulp and paper, and paperboard mills.
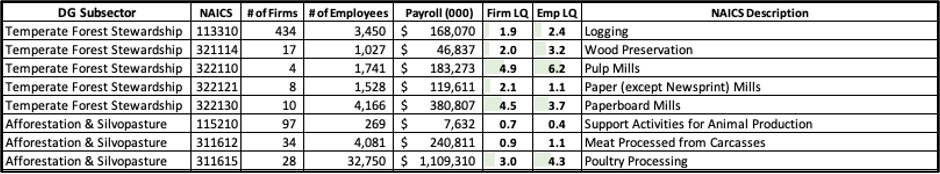
The SUSB data shows that logging, pulp, and paper mills are a big part of Georgia’s temperate forests. According to the EPA FLIGHT database, in 2021 Georgia’s pulp and paper industry had CO2e emissions of 3.5MMT (million metric tons), ranking the state highest for GHG emissions in that subsector. A related issue is that paper (and paperboard, cardboard, etc.) often end up as single-use products that are either recycled (requiring GHG emissions for energy used to recycle) or end up in landfills where they can decay and release methane (CH4), a potent GHG.
The other Land Sink subsector is silvopasture, a practice of ranching within the forest instead of clearing the land for grazing. White Oak Farms in south Georgia practices the Savoy Institute’s Savannah paradigm, allowing for 20% of grazing fields to be covered by trees. Beyond grazing animals, silvopasture research suggests that it could also provide significant benefits for the poultry industry, which could be a massive win for the low-carbon transition in Georgia.
Signing Off
This four-part blog post has been a synthesis of research intended to assess the potential for a green bank to accelerate the goals of Drawdown Georgia. It’s hardly a complete effort, and the research will continue. Areas of particular interest for further research are:
- The U.S. Census SUSB data is released annually and should be updated to see how recent federal incentives and higher interest rates impact key subsectors.
- There is a large number of scholarly and industry analyses associated with NAICS codes. Seeking additional details on the underlying businesses will allow future efforts to reassess and refine the NAICS codes mapped to each of the 20 solutions.
- The NAICS codes are also used by business and economic analysts looking for trends and opportunities in the market. Future research could enhance the data by adding industry-level financial metrics to mapped NAICS codes.
- Adding firm-level financial metrics and industry trends will enable future research to determine the strength and direction of the transition’s impact at the subsector level. This can support additional incentives for targeting the most impacted sectors and minimize some of the socio-economic damage.
- Matching the targeted NAICS codes to the Bureau of Labor Standard Occupational Codes (SOC) would augment the dataset with skills and job characteristics of target industries. This could enable targeting subsidies toward employees most likely impacted by the transition.
- Matching the targetted NAICS employment data to the Department of Energy’s United States Energy and Employment Report (USEER) which matches jobs to the technologies they support allowing us to separate traditional manufacturing from low-carbon manufacturing jobs.
In the meantime, share these posts with anyone who may learn from them or help advocate for more green banks globally. Most of the research and tools developed to do this assessment can be easily replicated for any U.S. state and even other countries with adjustments for some data sources. Feel free to reach out if you want to learn more.