Last week we introduced the Jawaharlal Nehru Solar Mission and explained the reality of the energy situation in India. Will it be possible for India to reach the goal of 20GW of installed solar capacity by 2020? We built a model to test the feasibility, and today we’ll share our findings.

Our Model
The model is based on investment in energy (both public and private) and the cost of solar. We assumed that if GDP increases, capital expenditure should increase too; if capital expenditure increases, then it’s safe to assume that investment in energy does as well. Based on current data, we projected these figures through 2020, compared them with other countries, and divided the increasing expenditure by the declining cost of solar to determine GW installed. (For those who are interested in the details, below is a more detailed summary of our model and projections. Skip to the interactive chart if you prefer visualization.)
GDP. India’s GDP is $1.73 Trillion (current USD) and growing at 9% per year. (EIU, 2011; World Bank, 2011). Based on historical trends, we assume that GDP growth is declining slowly. By 2020, we estimated that growth will be 6% and GDP will be $3.86 Trillion (current USD).
Investment in Energy. In 2011, energy expenditure with private participation was $31.6 Billion (current USD), which makes up 5.4% of infrastructure investment and about 1.5% of GDP in 2011 (World Bank, 2011; OECD, 2011). We project that this will increase to 7.5% of total investment in infrastructure by 2020, because energy will be an attractive market and higher priority for investors both public and private, explaining the increase. However, overall infrastructure investment will remain relatively consistent going from 31% to 35% of GDP, as is consistent with global averages.
Investment in Solar Energy. Historically investment in solar has been less than 1% of investment in total energy. In 2011, $315 million (current USD) was invested in solar energy in India (IEA, 2011). Our projections indicate, due to declining cost of solar and the increase in incentives, that solar expenditure will most certainly increase as a percentage of total investment. Our projection is in line with the historical incremental additions of solar and the total investment in energy.
Our Prediction
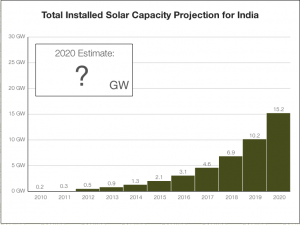
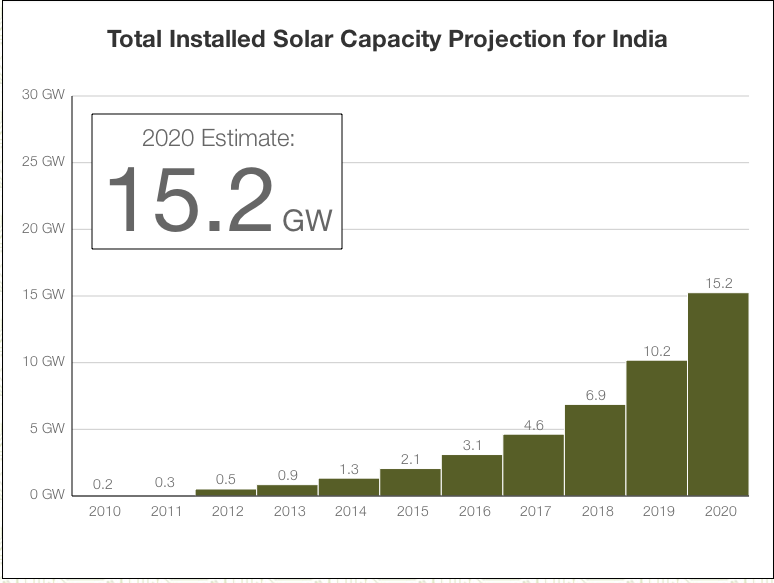
Based on our midline projections, India will not reach 20 GW of installed solar capacity by 2020 (see chart). We predict, based on current spending and trends, that India can install at least 15.2 GW of solar by 2020.
However, the goal is not impossible. The most sensitive variable in our projections is the cost of solar, as you’ll notice on our interactive chart which is linked below. From a variety of sources, we estimated that it would be $1/watt in 2020, down from approximately $3.40/watt today. If the cost of solar declines much faster, then installed capacity should increase faster. Alternatively, if GDP maintains a higher growth rate than its historical average investment in energy could increase as well.
What Is Your Prediction?
Our projections represent a base case. While we projected best and worse case scenarios as well, we wanted to turn to you, our readers, to offer additional insights to develop alternative scenarios with the use of our interactive site. By clicking on the chart below, you will be redirected to an interactive site with all of our projections and you fine tune the variables. Experiment with the variables: tell us what combinations of variables will allow India to reach 20 GW of installed solar capacity, and why they could be realistic. Take a screenshot of the chart with your predictions and share it with us on our Facebook page, and leave a comment to let us know.
Special thanks to ID Intern, John Coogan, for developing the interactive site.
Click the image to or this link interact.
Works Cited
International Energy Agency. 2011. “IEA Statistics.” Site.
OECD. 2011. “National Accounts.” Site.
World Bank. 2011. “World Bank Indicators.” Site.
World Bank. 2011. “Private Participation in Infrastructure Project Database.” Site.

